![]()
The F21 Simulator is free as are the example and demo programs that run on both the F21 simulator and the F21 emulator. The latest version of the simulator and demos is found on the F21 Simulator Updates page.
To create a new F21.EXE executable execute F.EXE FLOAD SIM-F21.SEQ at
the DOS command prompt. To start F21 with a source file enter F21.EXE MYFILE.SEQ
at the DOS command prompt or link this command to an Icon in Windows.
       When the program starts the screen will look like this:

       PC=     0 PC@=     0 |  0  0  0  0 |     0     0     0     0 .....
                               ^ JMP 0
        A=     0     0     0     0     0 <>     0     0     0     0 ........

       R3=     0
       R2=     0
       R1=     0     0     0     0     0 <>     0     0     0     0 ........
        R=     0     0     0     0     0 <>     0     0     0     0 ........
        T=     0     0     0     0     0 <>     0     0     0     0 ........
        N=     0     0     0     0     0 <>     0     0     0     0 ........
       S2=     0
       S3=     0
       S4=     0
       S5=     0

       0  instructions in 0  nanoseconds
       B1= 123456
       B2= 123456
       B3= 123456   IP Break Point
       [COMMANDS:     SPACE A B C D F G H L N R T Z + -]
The original S21 simulator for the MuP21 microprocessor was modified by Dr. Michael Monvelishsky, Jeff Fox, and Maxim Sokolnikov to support F21 development. The program was modified to reflect the 18 cell deep data and 17 cell deep return stacks on the F21 chips and the chip timing and register addresses were modified to reflect current F21 designs. The S21 simulator was written in FPC and used arrays in memory that could be loaded from or saved to disk to simulate 16K words of MuP21 memory. The F21 simulator uses virtual memory feature of FPC to simulate the full 1M word DRAM memory space of the F21 in the PC file TARGET.P21 The F21 program also combines the F21 simulator/debugger with the hypertext view and editing capabilities in FPC and an F21 assembler to create a combined simulator/debugger/assembler/editor.
This F21 simulator/debugger/assembler/editor has been certified for simulating F21 programs and has been used to debug complex commercial programs that were later run on actual chips.
The program will respond to any of the commands listed on the bottom line of the F21 screen. The "H" key will display the following screen:
       F21 simulator command help

       <--    move back one 5 bit instruction
       -->    move forward one 5 bit instruction
       (up)   increment the current 5 bit instruction
       (down) decrement the current 5 bit instruction
       Space  Single step current instruction
       A      Set new ProgramCounter ADDRESS
       B      Set Breakpoint 1 or 2 or 3
       D      Set consecutive DATA locations in memory
       E      Edit source file
       F      Forth
       G      GO execute code till a breakpoint
       H      Help for simulator/debugger
       L      Load source file
       N      NEXT word Increment IP BREAKPOINT and GO
       R      Set F21 Register (A,T,N,S2,S3,S4,S5,R ,R1,R2,R3)
       T      Toggle Video On/Off
       V      show video page
       Z      Zero Instruction and Time counters
       +      Increment  Breakpoint 3
       -       Decrement Breakpoint 3

       HIT ANY KEY TO CONTINUE
       PC=     0 PC@=     0 |  0  0  0  0 |     0     0     0     0 .....
                               ^ JMP 0
The first four command keys are the arrow keys. These four keys are the command interface to the assembler/disassembler for the F21. The top two lines of the screen, and the four arrow keys are all that are needed to use the assembler/disassembler. The top line on the F21 screen shows the contents of the Program Counter (PC= 0). The contents of the memory location pointed to by the program counter is then shown as (PC@= 0). Since each word of the F21 memory can contain up to four five bit instructions the contents of the memory pointed to by the program counter is also displayed as four five bit values between 0 and 1F (| 0 0 0 0 |). On the line below the top line an up arrow points to the five bit instruction that is the next instruction to execute on the F21. The current instruction is disassembled on this second line after the up arrow pointer.
The left and right arrow keys move the pointer to the current instruction forward or backward. The up and down arrow keys increment and decrement the current five bit instruction. Since there are only 32 opcodes on the F21 the opcodes wrap around from 1F to 0 and from 0 to 1F.
Following the display of the contents of the memory location pointed to by the program counter as four five bit instructions, the contents of the next four memory locations in the F21 are displayed in hex. Following the hex displays these five memory locations are also displayed in ASCII. If the contents of these locations are less than the space character, or if they are greater than 255 only a period is displayed (.....).
Below the Program Counter and instruction memory display on the top two lines of the display are the registers and memory locations pointed to by the F21 registers. The names of the F21 registers are displayed on the left of the screen. The A or address register is displayed at the top of the register display. Below this is the stack array. The top four return stack registers and the top five data stack registers are displayed back to back so that the operation of the F21 "PUSH" and "POP" instructions can clearly be seen moving data between the two stacks as one register array.
It should be noted that the data stack is actually 18 registers deep and has a circular array of 16 registers at the bottom. The return stack is 17 registers deep and has a circular array of 16 registers at the bottom. The way this functions is that if a 0 and a 1 and a 2 are placed on the F21 data stack in that sequence when the 2 goes into the T register the 1 will go into the S (second) register and the 0 will be written to the register in the circular 16 register array that is pointed to by the current value of an internal 4 bit register. If 15 more items were written then all the data stack registers would be filled. If the items were written with their sequence values as the first the three then when things fill T would contain 11H, S would contain 10H, and values 0 through 0FH would be in the 16 circular data stack registers. If the values in the stack are removed the bottom 16 items will repeat as the four bit pointer wraps while pointing to the active register in the stack array. In the example above if we removed items from the stack we would get 11,10,F,E,D,C,B,A,9,8,7,6,5,4,3,2,1,0,F,E, D,C,B,A,9,8,7,6,5,4,3,2,1,0,...
The four locations in memory below the location pointed to by each of the middle four registers is displayed to the right of the register. A "<>" is then displayed, and it is followed by the contents of the location in memory pointed to by the register, and the three locations that follow that in memory. If the register is being used as a stack pointer then the four locations to the left of the "<>" are the top four items on the stack. The number just to the right of the "<>" is the location in memory actually pointed to by the register.
To the right of these eight hex numbers the same eight values are also displayed as ASCII. If the contents of these locations are less than the space character, or if they are greater than 255 only a period is displayed (........).
The SPACE_BAR is the command to single step the current instruction in the F21. Note that the function show by the disassembler will be performed when the spacebar is pressed. The time for this instruction to execute will be added to the total time counter just below the display of the registers in the F21 (0 instructions in 0 nanoseconds). A simple calculation of the average timing of instructions is displayed after instructions have begun to execute and until 64k instructions have been executed (16 instructions in 160 nanoseconds (ave 100 mips)).
To reset the Program Counter use the "A" command. The "A" command will prompt for a new Address for the program counter. The memory pointer can be set to DRAM 0-FFFFF, Slow SRAM 10000-13FFF, Fast SRAM 140000-143FFF, Slow ROM 180000-1BFFFF, or Fast ROM 1C0000-1FFFFF.
The "G" command will begin repeated instruction execution until one of the breakpoints is reached, or the "ESC" key is pressed. The program will display each instruction if trace is on, or nothing if trace is off until a breakpoint is reached, or "ESC" is pressed. One can also stop the execution of F21 programs by breaking out completely to the FPC Forth environment with the CONTROL_BREAK key. From FPC you can return to the F21 environment at the same point that you broke out with the command "CHIP" from the FPC FORTH environment. The "T" key in the F21 program toggles the trace function on and off.
Three breakpoints are provided for F21 program debugging. Breakpoints B1 and B2 are set to break to the debugger when the Program Counter value equals the value in either of these breakpoints. Breakpoint B3 is set to break if the value of the "R" register should equal the value in B3. Since the "R" register is used as the interpreter pointer in one F21 eForth model the B3 breakpoint is also referred to on the screen as the IP breakpoint. When you press the "B" key the program will prompt for "B1, B2, or B3" and accept a "1", a "2", or "3" key to designate the breakpoint to be set. Then the program will accept a value and set that value into the breakpoint.
The "N" command will increment B3 and perform a "GO". This is a very nice mechanism to trace through high level Forth words as the B3 breakpoint is linked to the "R" register or "IP" interpreter pointer in high level Forth. Do not use the "N" command with Forth words that change the IP such as high level BRANCH words. Also do not use the the "N" command on other words that increment the IP by more than one such as DOLIT that moves the IP past the next location as it reads the data in that memory location. For these instructions use the "+" command to increment breakpoint 3 past a literal, or use the "+" and "-" commands to move to a branch location.
If your code does not reach one of the three breakpoints you have set fairly quickly you should use the "ESC" key or "CONTROL_BREAK" to stop program execution and examine the registers.
Breakpoints 1 and 2 break the program whenever the program counter equals the value in either breakpoint 1 or 2. Breakpoint 3 can break on the value of A, R, or PC. With F21 variable OFF breakpoint 3 is set to break on R. This is because R is used for the IP in one F21 eForth. With the F21 variable ON F21 sets breakpoint 3 to either the A or the PC register. If the variable DTC is also ON then breakpoint 3 is set to A since in Direct Threaded F21 eForth the A register is the IP. If DTC is OFF and F21 ON then breakpoint 3 is the Program Counter since the PC is the IP in subroutine threaded code.
The "L" command will compile the source file loaded from the command line when the F21 program is started. The file can be edited with the "E" command with access to the hypertext link and index capabilities built into the FPC program editor.
The "F" command or with the "CONTROL_BREAK" key will exit the F21 program to Forth. One has access to any FPC word of feature from the command line. To restart the simulator/debugger/assembler/editor from Forth type either "CHIP" or "SIM". The Forth command "CHIP" restarts just where you left off. The Forth command "SIM" restarts the simulator and resets some of the registers and variables. If you are in Forth you can exit to DOS with the "BYE" command or you can temporarily spawn a new DOS shell command prompt by using the control-enter key combination in FPC.
The "D" command will load consecutive locations in memory with data. It will prompt for the data to be loaded in each word as it increments the program counter which is used as a pointer. The value FFFFF cannot be entered directly as it is the special number that terminates the data entry mode. If you want to enter -1 simply enter a -1. -1 is actually 1FFFF in a 21 bit register, but memory can only hold 20 bits, so FFFFF will be placed in memory.
All registers execpt the Program Counter are set with the "R" command. The "R" command will only accept the register names that are displayed on the display (A,R3,R2,R1,R ,T,N,S2,S3,S4,S5). After a register has been designated then a value will be accepted and the register value set.
The F21 program simulates the F21's DRAM memory of one million 20 bit cells in FPC virtual memory in the file TARGET.P21. All changes to the F21 memory will be saved in the TARGET.P21 memory image. Just as with the S21 simulator the .P21 extension represents a target DRAM memory image.
The souce code to the F21 simulator/debugger/assembler/editor program is in the .SEQ files distributed with the F21.EXE file. To compile a new copy of F21.EXE enter F FLOAD SIM-F21.SEQ. SIM-F21.SEQ is the top level source file. The file F21ASM.SEQ contains the code to simulate the F21 instructions. The file VGA2.SEQ contains the code for display of the simulated F21 composite video output (center 320x400 pixels only) in the 320x400 VGA video mode. VID-F21 contains the code that decodes the F21 memory image bitmap for display in VGA mode. BLOCK.SEQ is the virtual memory block code from FPC. REAL-F21.SEQ contains the code for simulating the internal operation of the F21 chip. WATCHING.SEQ contains the source code for the simulation of timing, dissassembly, initialization and display of information in the F21 program.
Composite Video Output Simulation
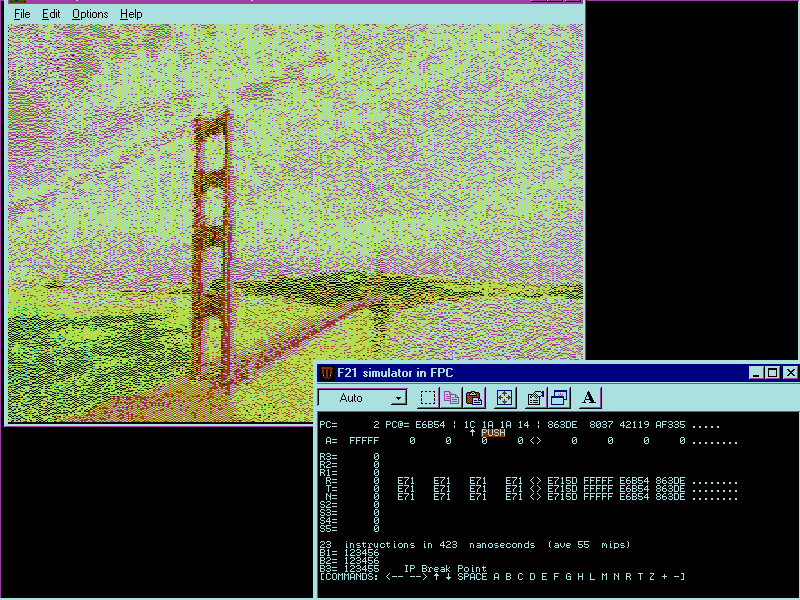
The image of the golden gate bridge displayed below was decoded from a GIF file, dithered for display on a 320x400 pixel 15 color display in the center of a composite video 384x482 image in the memory map of the video output coprocessor by a program debugged and run on the simulator. The image below was displayed by the V key in the simulator/debugger/assembler/editor and then captured and put back into a GIF format for display on the Web.
(c) Copyright Ultra Technology 1998
![]()
Ultra Technology
2512 10th St.
Berkeley CA 94710